
The managing director of an estate agency approves the same development invoice every month. The amount has not changed in two years. What has changed is what it buys: last spring it paid for a new valuation form, a map search and a redesign of the listing page. This spring it paid for the valuation form to be fixed twice and one new filter.
Nothing on the invoice explains the difference. The hours were worked. The cost of technical debt almost never appears as a line of its own, which is why it goes unchallenged for so long.
Where the cost shows up
Debt is paid in four places, and only the first is anywhere near an invoice.
- Slower changes. The same request takes more hours than it used to, because part of every job is working around what is already there.
- Rework. Changes that break something else, fixes that need fixing, checks done by hand because nothing checks automatically.
- Exposure. An unsupported platform or an abandoned component is a cost that has not arrived yet. It arrives all at once.
- Things not done. The campaign page that was not worth three weeks, the idea nobody raised because they knew the answer.
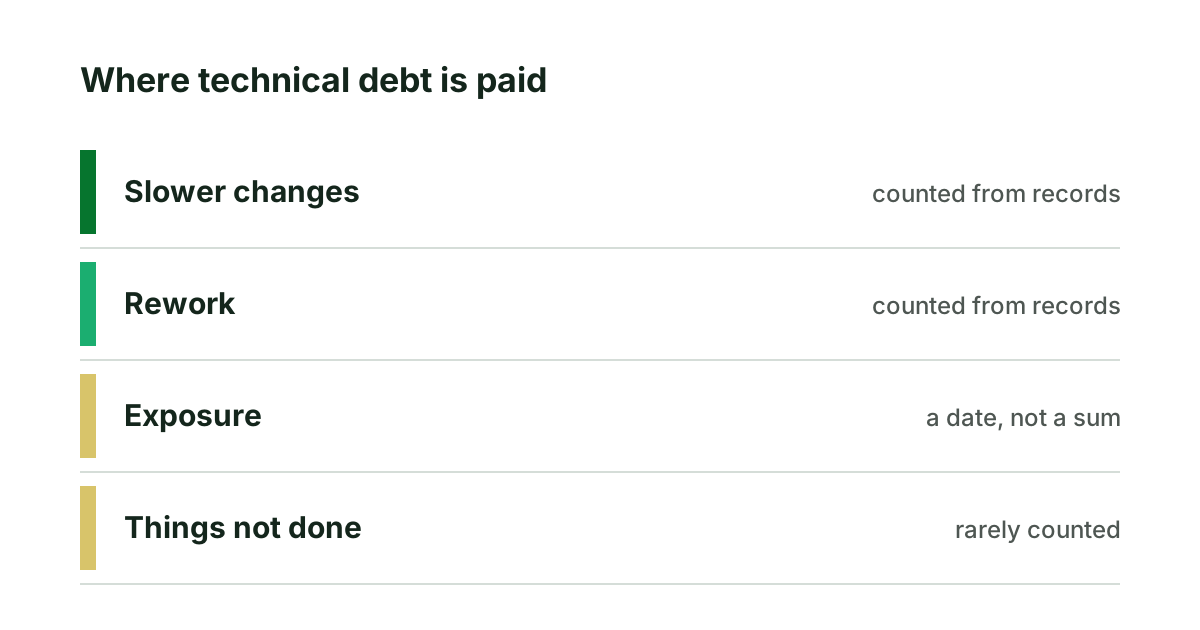
The fourth is usually the largest and is never measured, because nobody keeps a list of what they stopped asking for.
Principal and interest, with numbers
The idea of principal and interest is introduced in technical debt explained. Martin Fowler gives it figures. Suppose a feature would take four days in a clean system and takes six in the one you have. The two extra days are the interest. Cleaning up that part would take five days: that is the principal.
His point is the one a budget holder needs. Paying five days to save two is a loss if you do it for a single feature: nine days instead of six. It becomes a gain only when more work is coming through the same part. So the cost of debt is not a property of the code. It depends on how often you need to change the place where the debt sits.
That gives a plain rule. Debt in a part of the system the business changes every month is expensive. The same debt in a part that has not been touched in two years costs close to nothing, and paying it off is money spent for no return.
How to put a figure on it
A precise figure is not available and not needed. What is needed is a figure good enough to set beside the price of a repair. Build it from three lines.
- Interest on changes. Take the time a standard change needs now and what it needed before, as described in measuring technical debt. The share of the difference, applied to what you spend on changes in a year, is the first line.
- Rework. Count the releases in the last quarter that needed a follow-up fix, and the hours those fixes took. Four times that is a year's worth.
- Delay. Pick the two changes the business wanted most this year. Ask what each month without them cost: enquiries not received, staff hours spent on a manual step. Rough is fine, written down is essential.
Leave exposure out of the sum. A security failure or a platform that stops working cannot honestly be given an annual figure. State it separately, as a date and a consequence: "support ends in March; after that a fault in the platform will not be fixed by anyone".
The total of the three lines is the yearly cost of leaving things as they are. It is the number every proposal should be compared with, including the proposal to do nothing.
Pricing the estate agency's slow search filter
Back to the estate agency from the opening, an invented one. Its site lists properties and takes valuation requests.
A new search filter took eight working days this year. A similar one took three days two years ago, with the same developers. Five of every eight days spent on changes are interest. The agency spends about a hundred and twenty developer days a year on changes, so roughly seventy-five of them buy nothing new.
Three of the six releases in the last half year needed a fix afterwards, at about two days each: over a year, around twelve days. The change the business wanted most, valuation requests by postcode, was put off for five months because the estimate was too high.
The developers say the interest sits in one place, the property search, which every request touches. Rebuilding that part is estimated at forty days. Forty days against seventy-five a year, with the delayed feature becoming affordable as a result. The rest of the site, including an old mortgage calculator that the tools flag as the worst code of all, is left alone, because nobody has asked for a change to it since it was built.
Putting a figure on your own debt
- Ask where the last three slow jobs spent their time. If the answers name the same part of the system, you have found where the interest is paid.
- Write the three lines for that part only. Do not try to price the whole system.
- State the exposure separately, with its date.
- Compare the yearly figure with the estimate for repairing that part, then decide. Keeping the debt down afterwards is a matter of routine, covered in managing technical debt.
If the interest turns out to be everywhere and not in one part, the comparison is with a rebuild, and that needs a baseline of the whole site first. Our website modernization work starts with a fixed-scope assessment that provides one.
Sources
- Martin Fowler, Technical Debt, 2019.
Keep reading
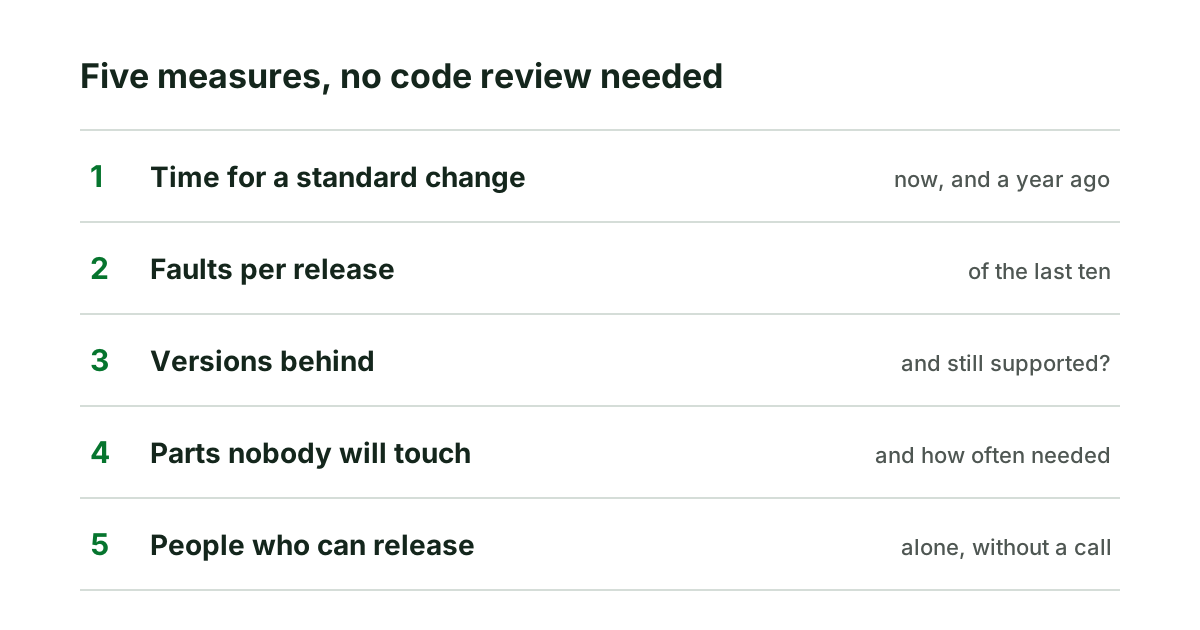
Measuring technical debt without reading the code
Five measures a non-technical owner can ask for to size technical debt, how to read them together, and why a single debt score misleads.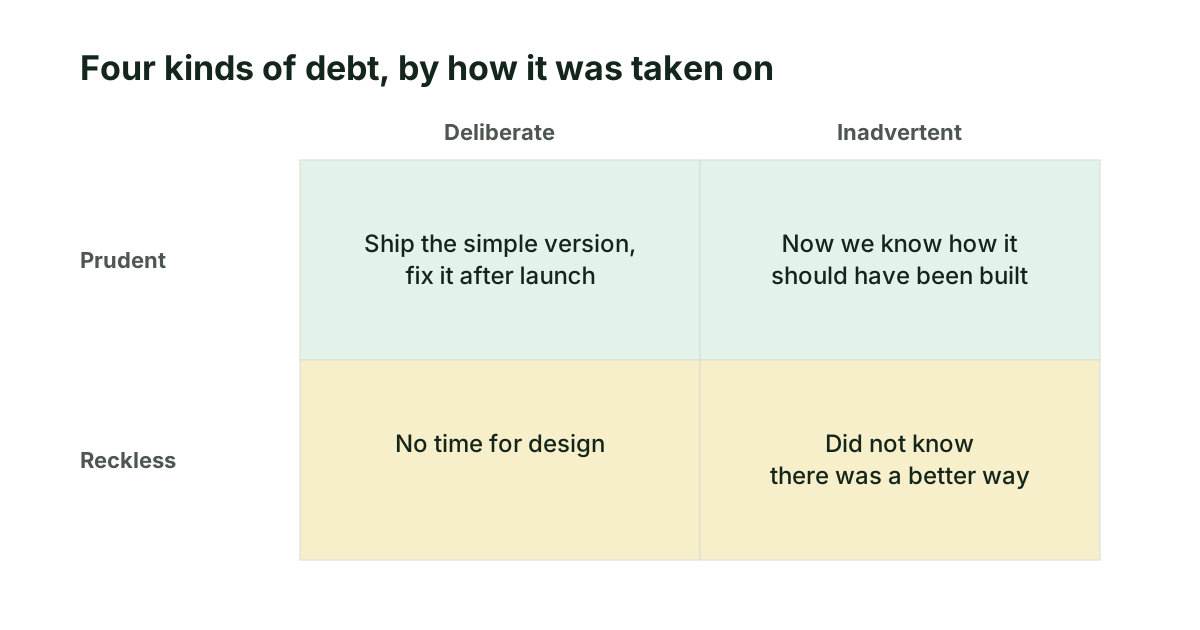
Types of technical debt, and which ones to worry about
Technical debt is not one thing. The four kinds by how they were taken on, the six places they sit in a website, and which deserve attention first.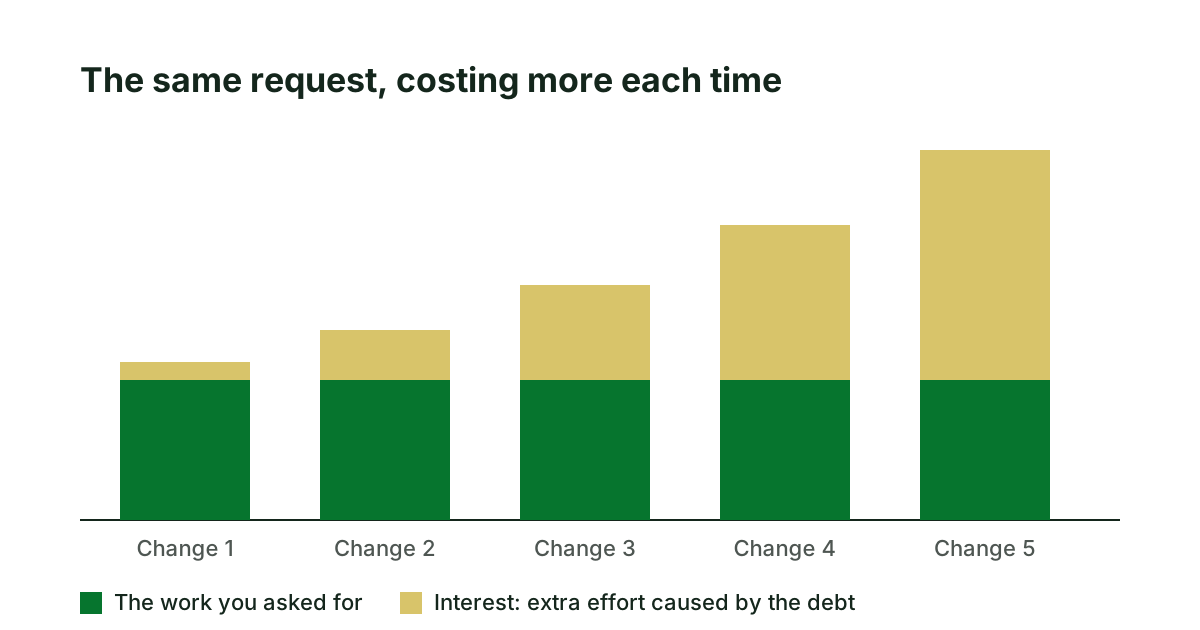
Technical debt, explained for the person who pays for it
What technical debt is, where it comes from, how to tell useful debt from neglect, and the signs that it now costs more than fixing it would.